IC Markets Home Sign in Web Trader Contact Us
IC Markets Social IC Markets Social

مركز المعلومات
للمتداولين الجادينs

  • ABOUT US
  • OPEN LIVE ACCOUNT
  • OPEN DEMO ACCOUNT
  • TRADE NOW
  • VISIT OUR BLOG
IC Markets Social
  • ABOUT US
  • OPEN LIVE ACCOUNT
  • OPEN DEMO ACCOUNT
  • TRADE NOW
  • VISIT OUR BLOG
May 28, 2024Australian_Stocks_enIC Markets

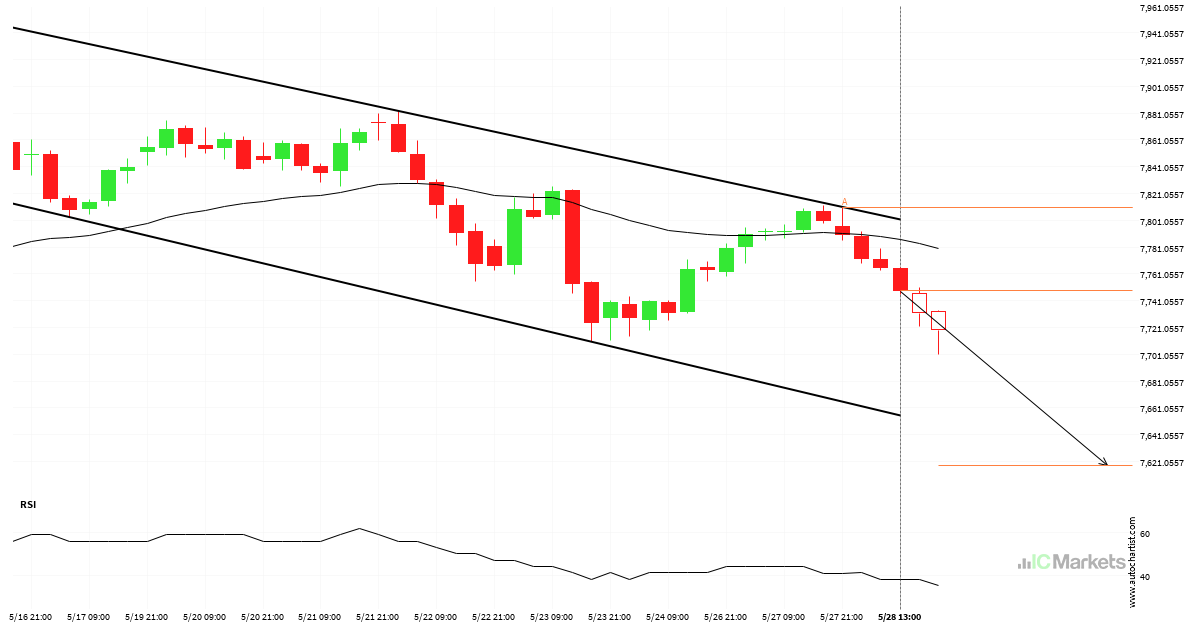
Australia 200 Index approaching support of a Channel Down

Australia 200 Index is approaching the support line of a Channel Down. It has touched this line numerous times in the last 13 days. If it tests this line again, it should do so in the next 2 days.

Read more
May 27, 2024Australian_Stocks_enIC Markets

Dramatic change in Hong Kong 50 Index. A sign of things to come?

Hong Kong 50 Index rose sharply for 4 hours – which is an excessively big movement for this instrument; exceeding the 98% of past price moves. Even if this move is a sign of a new trend in Hong Kong 50 Index there is a chance that we will witness a correction, no matter how […]

Read more
May 24, 2024Australian_Stocks_enIC Markets

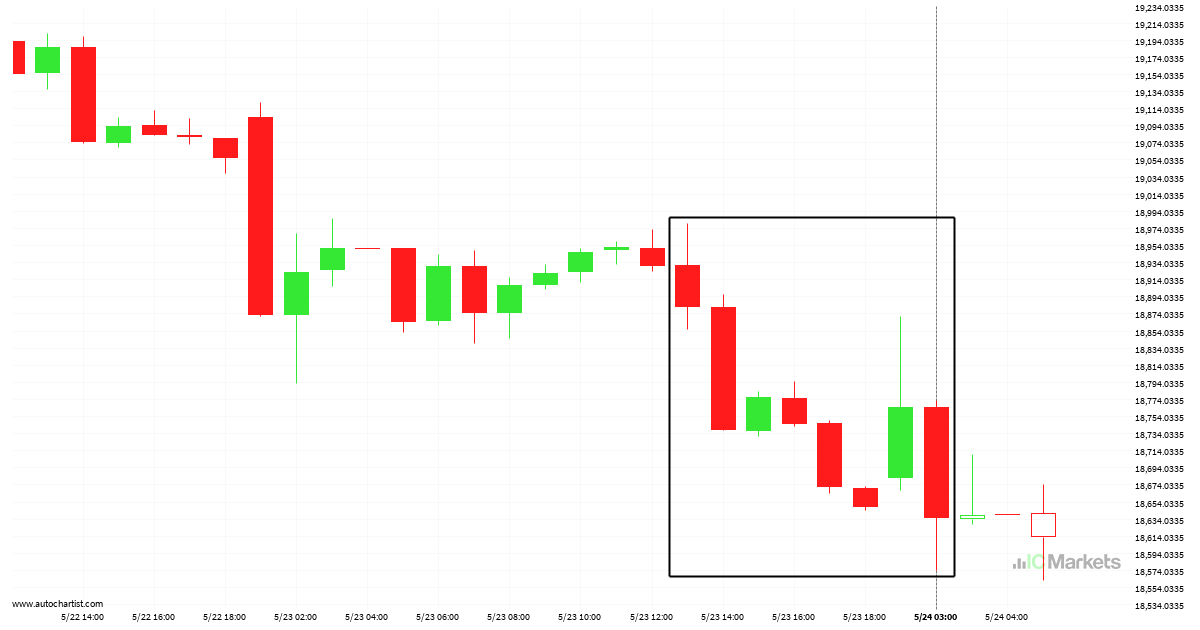
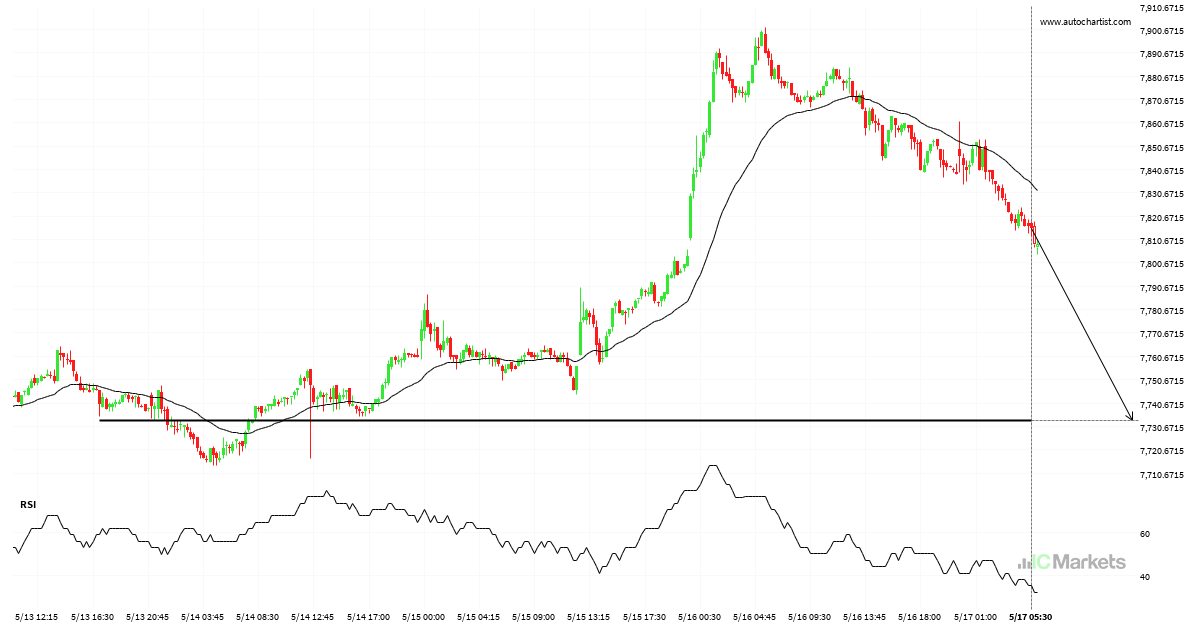
Hong Kong 50 Index is on its way down

Hong Kong 50 Index hits 18584.17 after a 2.01% move spanning 14 hours.

Read more
May 22, 2024Australian_Stocks_enIC Markets

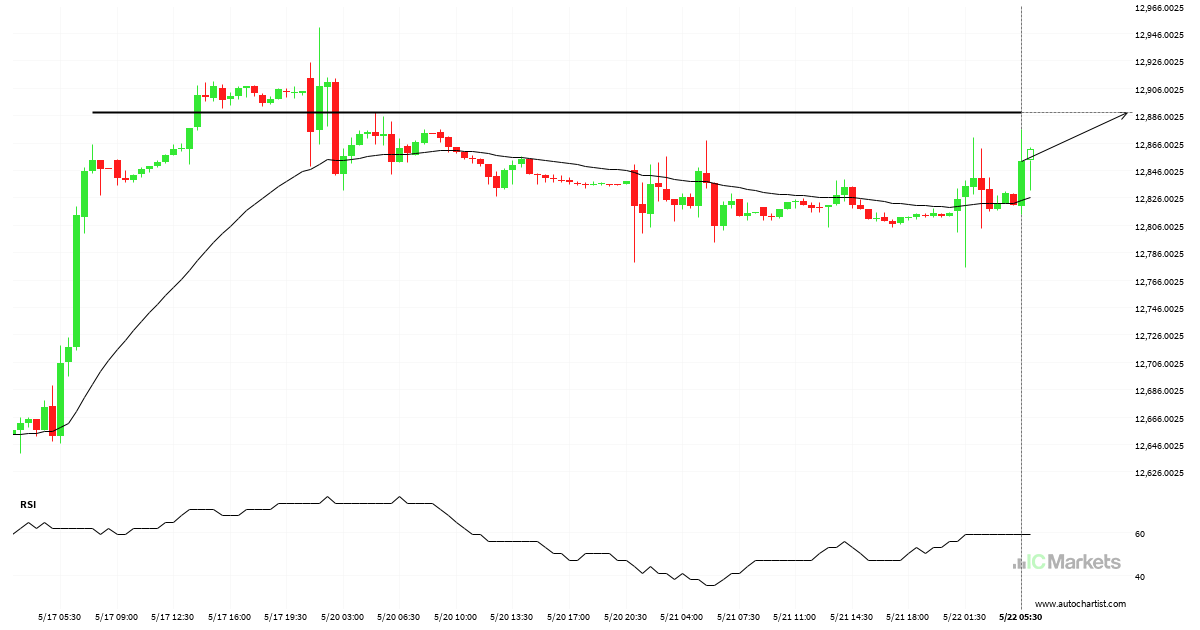
A final push possible on FTSE China A50 Index

FTSE China A50 Index is heading towards 12888.0498 and could reach this point within the next 13 hours. It has tested this line numerous times in the past, and this time could be no different, ending in a rebound instead of a breakout. If the breakout doesn’t happen, we could see a retracement back down […]

Read more
May 21, 2024Australian_Stocks_enIC Markets

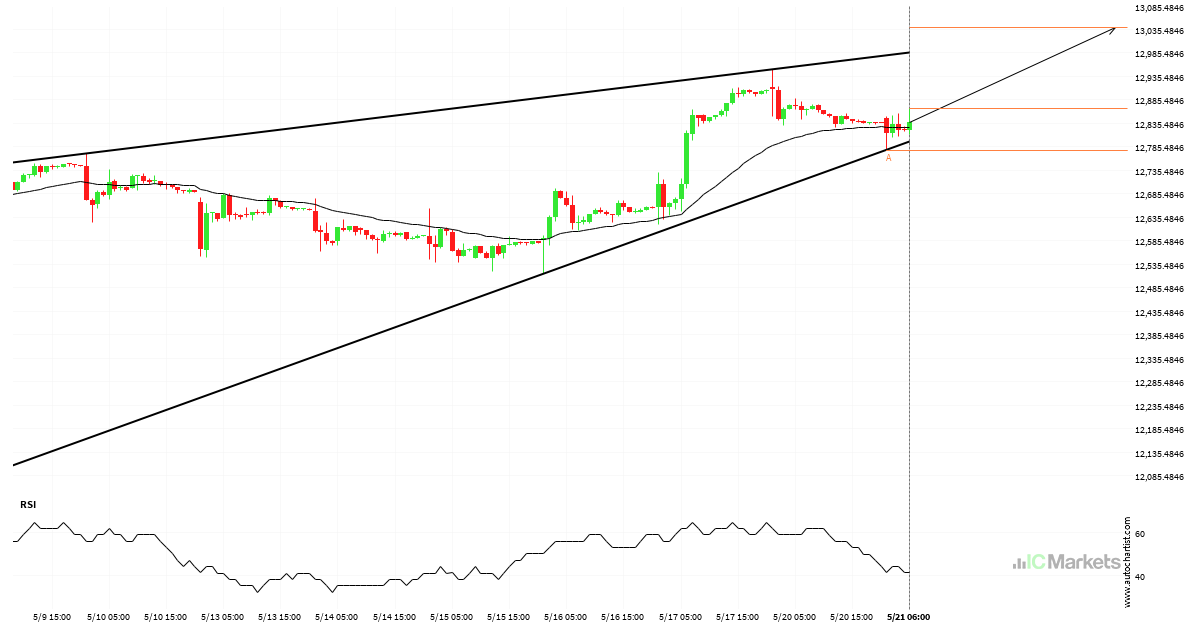
Either a rebound or a breakout imminent on FTSE China A50 Index

FTSE China A50 Index is heading towards the resistance line of a Rising Wedge. If this movement continues, the price of FTSE China A50 Index could test 13038.9200 within the next 2 days. It has tested this line numerous times in the past, so this movement could be short-lived and end up rebounding just like […]

Read more
May 19, 2024Australian_Stocks_enIC Markets

Hong Kong 50 Index is on its way up

Hong Kong 50 Index rose sharply for 16 hours – which is an excessively big movement for this instrument; exceeding the 98% of past price moves. Even if this move is a sign of a new trend in Hong Kong 50 Index there is a chance that we will witness a correction, no matter how […]

Read more
May 17, 2024Australian_Stocks_enIC Markets

Australia 200 Index approaches important level of 7733.0801

Australia 200 Index is moving towards a support line. Because we have seen it retrace from this level in the past, we could see either a break through this line, or a rebound back to current levels. It has touched this line numerous times in the last 4 days and may test it again within […]

Read more
May 16, 2024Australian_Stocks_enIC Markets

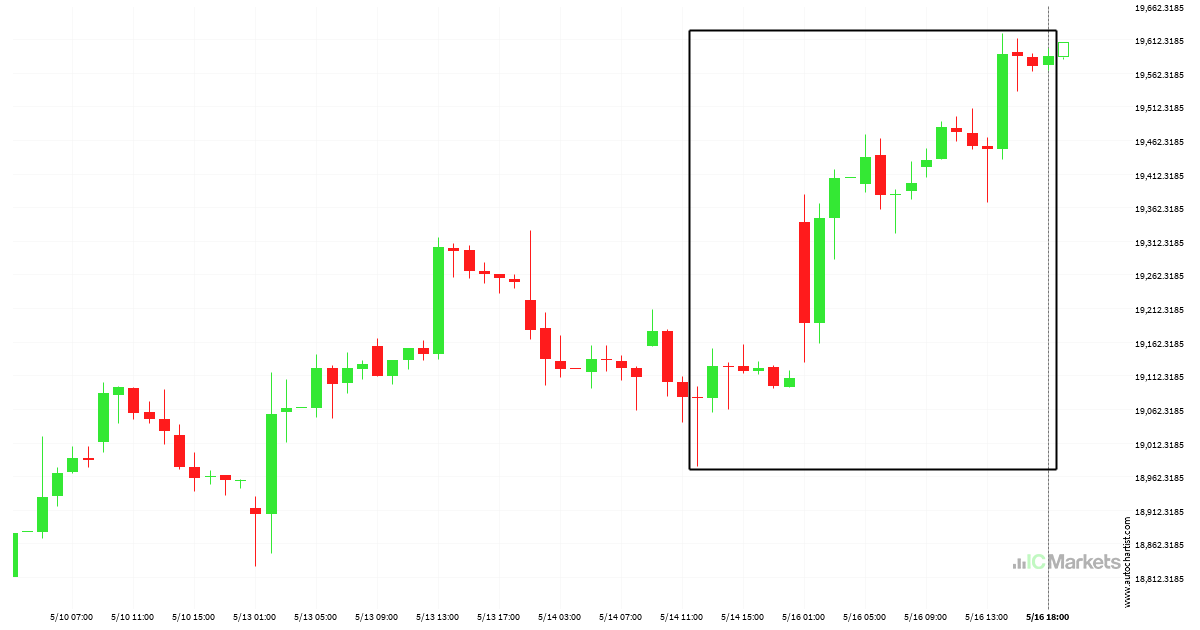
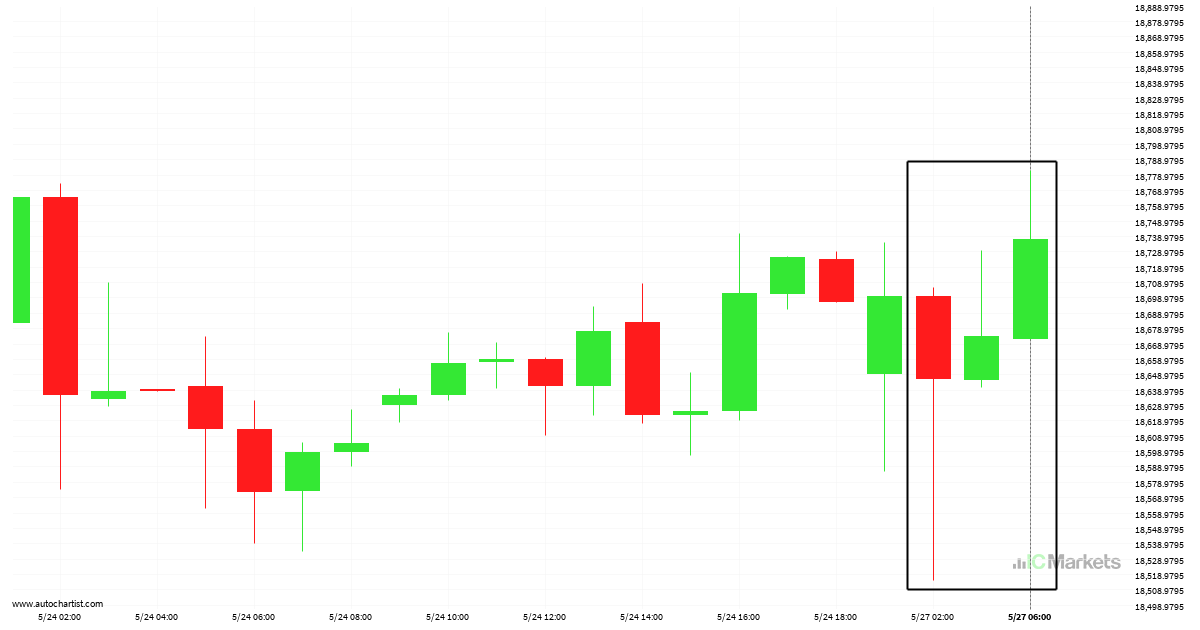
Where is Hong Kong 50 Index moving to?

Hong Kong 50 Index has moved higher by 2.74% from 19064.81 to 19586.62 in the last 3 days.

Read more
May 16, 2024Australian_Stocks_enIC Markets

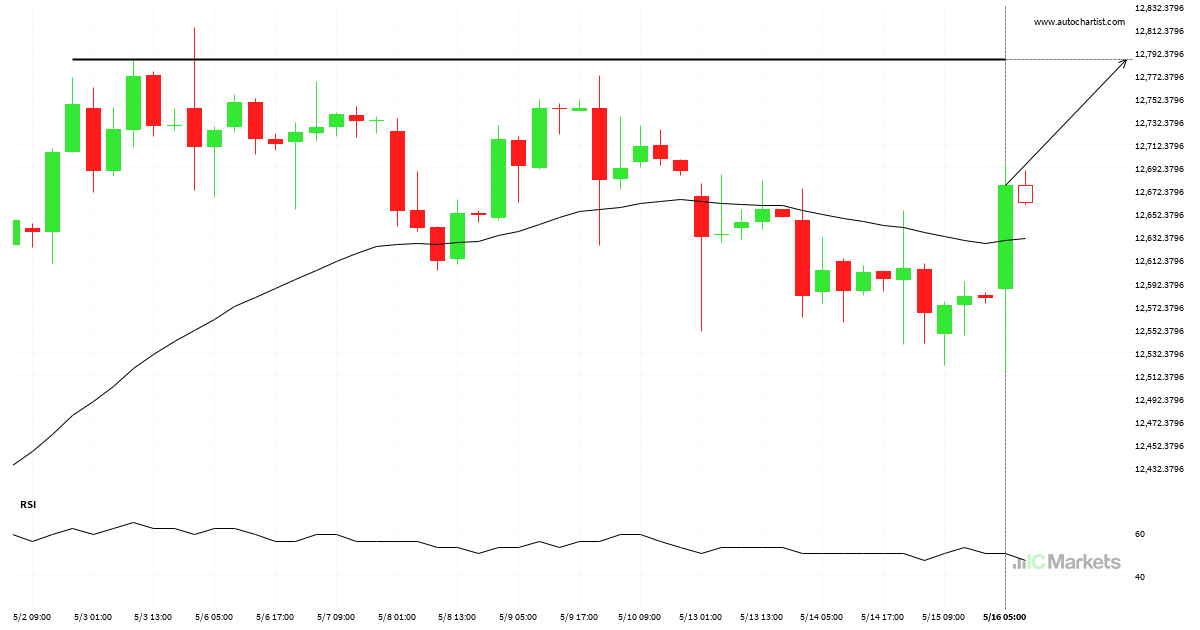
FTSE China A50 Index short term bullish trade setup to 12785.7002

The movement of FTSE China A50 Index towards 12785.7002 price line is yet another test of the line it reached numerous times in the past. We could expect this test to happen in the next 2 days, but it is uncertain whether it will result in a breakout through this line, or simply rebound back […]

Read more
May 15, 2024Australian_Stocks_enIC Markets

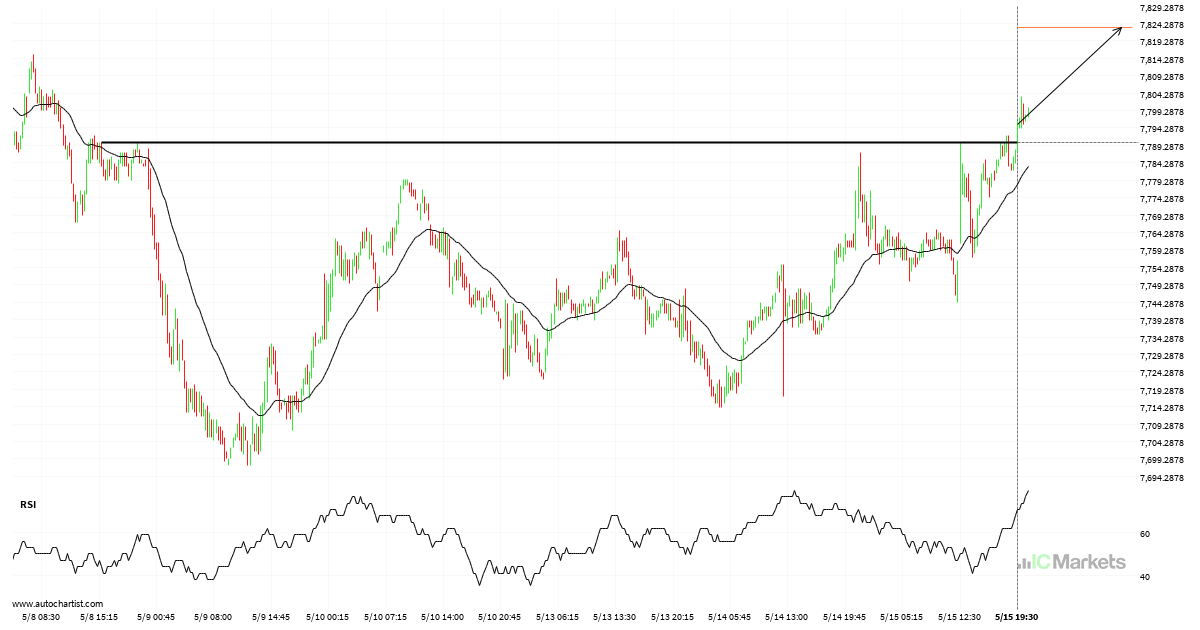
Should we expect a bullish trend on Australia 200 Index?

Australia 200 Index has broken through a line of 7790.2300. If this breakout holds true, we could see the price of Australia 200 Index heading towards 7823.0132 within the next 2 days. But don’t be so quick to trade, it has tested this line numerous times in the past, so you should probably confirmation the […]

Read more
  • 1
  • 2
  • 3
  • …
  • 10
  • 11
  • 12
  • 13
  • 14
  • 15
  • 16
  • …
  • 153
  • 154
  • 155

Recent Posts

  • Brent Oil vs US Dollar – نموذج الرسم البياني – قناة صاعدة
  • Brent Oil vs US Dollar – نموذج الرسم البياني – قناة صاعدة
  • Hong Kong 50 Index – نموذج الرسم البياني – مثلث صاعد
  • Hong Kong 50 Index – รูปแบบกราฟ – สามเหลี่ยมขาขึ้น
  • Hong Kong 50 Index – نموذج الرسم البياني – مثلث صاعد

Recent Comments

    Translation


     Edit Translation

    فتح الحساب وتمويله بشكل فوري

    تداول خلال دقائق!

    ابدأ اختبر حساب تجريبي مجاني

    نبذة عن IC Markets Global

    • مركز المساعدة
    • لماذا تختار IC Markets Global؟
    • التنظيم
    • الوثائق القانونية
    • اتصل بنا

    مواصفات التداول

    • الفروقات والعمولات
    • مجموعة المنتجات
    • ساعات التداول
    • التمويل
    • السحب

    تداول الفوركس

    • استعراض الحسابات
    • افتح حساب
    • إطلاق Web Trader


    Forex Trading

    • Accounts Overview
    • Open an Account
    • Launch Web Trader

    Trading Specifications

    • Spreads and Commissions
    • Range of Market
    • Trading Hours
    • Funding
    • Withdrawal

    About IC Markets

    • Chat with a Specialist 24/7
    • Why IC Markets
    • Regulation
    • Legal Documents
    • Contact Us

    IC Markets Global هو الاسم التجاري لشركة Raw Trading Ltd، التي تخضع لرقابة هيئة الخدمات المالية في سيشل (FSA) برقم ترخيص تاجر الأوراق المالية SD018.

    تحذير من المخاطر: ينطوي تداول الفوركس وعقود الفروقات على مخاطر عالية على رأس المال، لذا يُنصح بالتداول فقط بالأموال التي يمكنك تحمل خسارتها. قد لا يكون تداول الفوركس وعقود الفروقات مناسبًا لجميع المستثمرين، لذا يُرجى التأكد من فهمك التام للمخاطر المُحتملة، وطلب استشارة مستقلة عند الحاجة. يُرجى قراءة بيان إفصاح المخاطر والتأكد من فهمك التام له.

    الدول المحظورة : لا تقدم شركة Raw Trading Ltd خدماتها لسكان دول معينة مثل الولايات المتحدة الأمريكية وكندا والبرازيل وإسرائيل ونيوزيلندا وإيران وكوريا الشمالية (جمهورية كوريا الشعبية الديمقراطية) أو دولة يكون فيها مثل هذا التوزيع أو الاستخدام مخالفًا للقانون أو اللوائح المحلية.

    يجب أن تكون قد بلغت الثامنة عشرة من عمرك، أو السن القانوني المحدد في بلدك. بتسجيلك حسابًا لدى شركة رو تريدينج المحدودة، فإنك تُقر بأنك تُسجل بمحض إرادتك، دون أي تحريض من جانب Raw Trading Ltd .

    لا تُوجِّه Raw Trading Ltd موقعها الإلكتروني وخدماتها لأي فرد في أي دولة يُحظر فيها استخدام موقعها وخدماتها بموجب القوانين أو اللوائح المحلية. عند الوصول إلى هذا الموقع من دولة قد يُحظر فيها استخدامه، تقع على عاتق المستخدم مسؤولية ضمان توافق أي استخدام للموقع أو الخدمات مع القوانين أو اللوائح المحلية. لا تُقرّ شركة Raw Trading Ltd بأن المعلومات المتوفرة على موقعها الإلكتروني مناسبة أو صالحة للاستخدام في جميع الولايات القضائية.

    الوثائق القانونية

    © 2022 Raw Trading Ltd | All rights reserved.
    • Sample Page